Direct Answer: The Yellow Line has run since 10 August 2025. BMRCL's spokesperson says daily ridership rose from 81,365 that first month to 1.2 lakh by July 2026. Knight Frank's H1 2026 band for Electronic City flats is ₹5,700 to ₹8,600 per sq ft, up 10% in twelve months and 2% in the latest six. Colliers' "almost 45%" is dated, in the table printed with it, as 2025 against 2023.
A brochure will sometimes treat "Yellow Line open" and "Electronic City has re-rated" as one sentence. One is a train you can board. The other is a price, and it depends on which window somebody picked. On 2 November 2026 the line had been open a bit more than fifteen months. The ridership story is from August. The price table stops at H1 2026.
What opened on 10 August 2025?
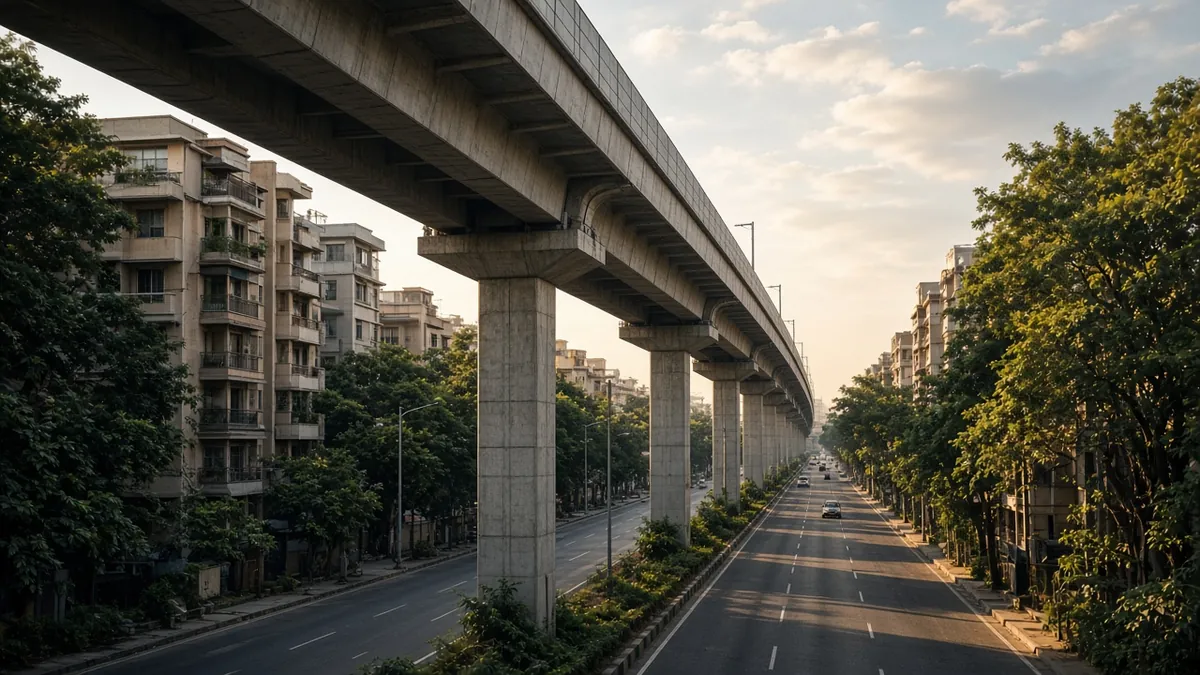
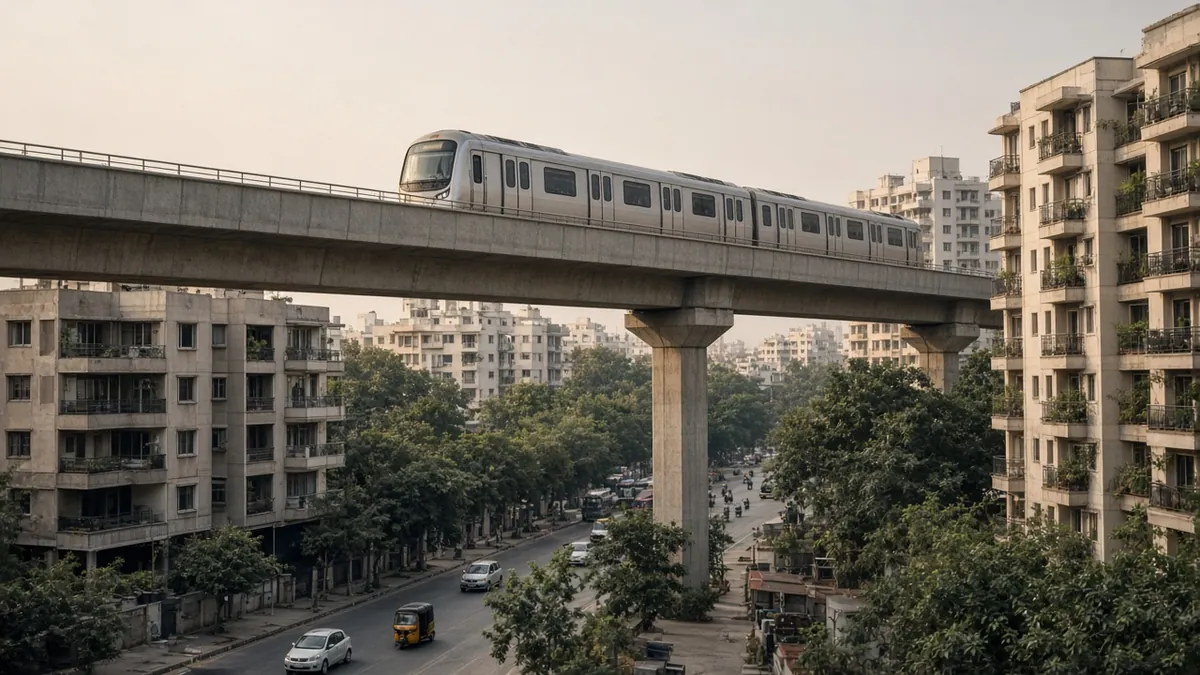
The Press Information Bureau's note that day says the Prime Minister inaugurated the Yellow Line from RV Road (Ragigudda) to Bommasandra: over 19 km, 16 stations, project cost around ₹7,160 crore. Bengaluru's operational metro network went to over 96 km. The note says travel between Basavanagudi and Electronic City would be significantly shorter. It gives no minute count, so this page will not invent one.
Are people actually using it?
On 14 August 2026 The Times of India quoted B.L. Yeshwanth Chavan, BMRCL's chief public relations officer. This is a news report of what he said, not a BMRCL spreadsheet we can download.
| What was counted | Figure | As reported |
|---|---|---|
| Average daily ridership, August 2025 (services ran 21 days) | 81,365 | Chavan, via The Times of India, 14 Aug 2026 |
| Average daily ridership, July 2026 | 1.2 lakh | Same |
| Passengers in the first year | Over 3.8 crore in the article text. The headline says 3.7 crore | The Times of India, 14 Aug 2026 |
| Trains and frequency then | 10 trains. About 7 minutes in the peak, about 10 minutes off-peak | Chavan, same story |
The line began with three trainsets and a gap of about 35 minutes, because coaches were late. BMRCL had planned 15. The 15th arrived only in July 2026. For most of the first year it was open, and short of trains.
An official, not named in the piece, said the busiest flow is towards Electronics City, and that Hosur Road stations (other than the RV Road interchange) see the higher footfall. Rates, water and flood notes for that road are in the Hosur Road guide.
BMTC was running 28 feeder services from Yellow Line stations, close to 300 trips a day, with more than 15,900 passengers a day on those feeders. The Electronics City to Tin Factory feeder was the busiest, at more than 3,400 a day. That is a network total. It does not tell you whether a bus stops at your gate.
A station on the viaduct is not a station at the door. How far is too far, Phase 1 against Phase 2, is a separate question on Yellow Line walk distance. Time the walk from the gate, not from Hosur Road, with the 800 m station map.
Where does the 45% come from?
On 22 April 2026 The Hindu reported a Colliers view of the Yellow and Pink lines. Vimal Nadar, the firm's head of research, is quoted saying the operational Yellow Line had driven housing prices up by almost 45% in locations such as Electronic City. The Hindu story does not say from which year.
The same day The Economic Times printed a locality table and sourced it to "Industry, Colliers". These Yellow Line rows are not registered sales, and they are not Knight Frank.
| Locality in the ET table | Line | Change given for 2025 vs 2023 | Change called likely for 2027 vs 2025 |
|---|---|---|---|
| Electronic City | Yellow | 45% | 20% to 30% |
| BTM Layout | Yellow | 24% | 10% to 20% |
| Jayanagar | Yellow | 11% | 10% to 15% |
Read the Electronic City row across. The 45% is the change they assign to 2025 against 2023. The 20% to 30% is what they call likely for 2027 against 2025. One window is already over. The other is a forecast. Stacking them, as if a flat rose 45% and will then rise another 20%, is not what the table says.
The Hindu piece also says average housing prices in key localities may rise by up to 40% over the next two years. That is the top of a forecast for several places, not an Electronic City sale. The Pink Line rows are a different question, sorted in where Pink and Blue Line prices moved.
A third percentage is in circulation. Realty Plus, on 14 January 2026, wrote that Electronic City had seen close to 47% price growth compared with pre-metro levels. It names neither the start year nor the dataset. Five months after opening, "pre-metro" could mean almost anything. Without the sales behind it, it is a headline.
The same Hindu report is also an office forecast: 5 to 7 million sq ft of extra Grade A demand over two years in the CBD, SBD 2 and Electronic City, new supply of about the same size, stock in those micro-markets around 40 million sq ft by 2027, and rents likely firmer by 5% to 10%. Arpit Mehrotra of Colliers added that Yellow and Pink line office hubs could be 15% to 20% of the city's Grade A stock by 2027. None of that prices a flat.
What did Knight Frank measure by H1 2026?
Knight Frank's H1 2026 report has a rupee band, a 12-month change and a 6-month change. This is the series with a defined window.
| Electronic City | City, same report | |
|---|---|---|
| Price | ₹5,700 to ₹8,600 per sq ft | Weighted average ₹9,354 per sq ft |
| 12 months | +10% | +9% |
| 6 months | +2% | not the comparison used here |
Source: Knight Frank, India Real Estate, H1 2026, the Bengaluru residential price table, and the city price line in the same chapter.
The top of the Electronic City band, ₹8,600, sits under the city weighted average of ₹9,354. The bottom, ₹5,700, is well under it. "Caught up with the city" is not this table.
The 10% is the twelve months into H1 2026. The line opened on 10 August 2025, so that window mixes months before the trains with months after. It is not a clean before-and-after. The latest six-month change in the same cell is 2%. A slow half, in a year when the line was already open and, for much of it, still short of trains.
South Bengaluru, which Knight Frank ties to jobs at Electronic City and along Hosur Road, took 34% of city sales and 36% of launches in that half. That is a share of deals, not a price rise.
| Figure you may be quoted | What it actually is | Window |
|---|---|---|
| Almost 45% | Colliers, via The Hindu, "locations such as Electronic City" | Start year not stated there |
| 45% | ET table, "Industry, Colliers" | 2025 vs 2023 |
| Close to 47% | Realty Plus, "pre-metro levels" | Start year not stated |
| 10%, and 2% | Knight Frank band, ₹5,700 to ₹8,600 per sq ft | 12 months, and 6 months, into H1 2026 |
| 20% to 30% | ET table, a forecast | 2027 vs 2025 |
| Up to 40% | Colliers, via The Hindu, key localities | The next two years from April 2026 |
The band is wider than the 10%
Illustrative only. The two ends of Knight Frank's range, on 1,000 sq ft. Not an offer. Stamp duty, registration and GST sit outside it.
| End of the published range | ₹ per sq ft | On 1,000 sq ft |
|---|---|---|
| Bottom | 5,700 | ₹57,00,000 |
| Top | 8,600 | ₹86,00,000 |
| Gap | 2,900 | ₹29,00,000 |
The top is about 1.5 times the bottom (8,600 divided by 5,700). A 10% move is a smaller conversation than which end of the band a seller is pointing at. Ask what in the building is supposed to put this flat at the top.
Guidance values, and whether ELCITA, a city corporation or a panchayat runs the building, are in the Electronic City rates guide. Duty is charged on the higher of your price and that guidance value. The metro does not change the rule.
A brochure that still quotes an old opening month for another line is using a stale date. Where each line stands is in the metro lines guide.
What do you do with this at a site visit?
Write the seller's number down with its window. If they cannot say whether it is 2025 against 2023, the last twelve months, or "pre-metro", you do not have a number yet. Two or three deeds from the same block, on Kaveri, beat another percentage. The RERA page names the promoter and the completion date. It will not confirm a 45% rise. If the flat is being sold on the station, walk it at the hour you would leave, and ask which feeder runs then.
Buyer checklist: a Yellow Line price for Electronic City
- [ ] Opening date kept separate from the price window: trains from 10 August 2025, Knight Frank's band only through H1 2026
- [ ] Any 45% or 47% claim written down with its source and its start year, or marked "start year not stated"
- [ ] The 20% to 30%, and the "up to 40%", marked as a forecast, not a past sale
- [ ] Knight Frank's ₹5,700 to ₹8,600 read as a range, and the flat placed inside it with a reason
- [ ] Two or three registered deeds from the same block pulled on Kaveri
- [ ] Walk from the gate to the station timed, and the feeder checked at that hour
- [ ] Governing body checked: ELCITA, city corporation or panchayat
- [ ] RERA registration, promoter and completion date read for that project
Related reading
Frequently asked questions
No source we checked says that for the year since 10 August 2025. The Hindu, on 22 April 2026, quotes Colliers' Vimal Nadar saying the operational line drove housing prices up by almost 45% in locations such as Electronic City. That sentence gives no start year. The Economic Times the same day printed 45% for Electronic City as 2025 against 2023, labelled "Industry, Colliers".
In the H1 2026 table, ₹5,700 to ₹8,600 per sq ft, up 10% over twelve months and 2% over six. The city's weighted average in the same report was ₹9,354 per sq ft, up 9%. The Electronic City band's top sits under that city figure.
The Times of India, on 14 August 2026, quoted BMRCL's B.L. Yeshwanth Chavan: 81,365 riders a day on average in August 2025, when trains ran for 21 days, and 1.2 lakh in July 2026. The article text says over 3.8 crore passengers in the first year. The headline says 3.7 crore. The line spent much of that year short of trains, from about a 35-minute gap early on to about 7 minutes in the peak later.
That is the Electronic City forecast in The Economic Times table, for 2027 against 2025. It is not a registered price. Set the ask next to deeds in the same block, and next to Knight Frank's band, before you add a forecast to today's price.
Realty Plus wrote, on 14 January 2026, that Electronic City had seen close to 47% price growth compared with pre-metro levels. It names no start year and no dataset. If the sales are not produced, do not use 47% as a fact.
Lawyer note: The ranges, ridership figures and forecasts here come from the reports named below. They are not a valuation of your flat. A property lawyer should read the title, the khata and the RERA file before you pay. Verify with your lawyer before acting.
Sources
Checked 2 Nov 2026. Colliers' own press page did not open for us that day, so the Colliers comments are cited as The Hindu and The Economic Times printed them. News reports are marked. Consultant ranges stay inside the way each firm draws a location.
- Press Information Bureau, inauguration of the Yellow Line, 10 Aug 2025 (RV Road (Ragigudda) to Bommasandra, over 19 km, 16 stations, about ₹7,160 crore, operational network over 96 km): https://pib.gov.in/PressReleseDetailm.aspx?PRID=2154848
- The Times of India, Suchith Kidiyoor, Yellow Line's first year, 14 Aug 2026, quoting BMRCL's B.L. Yeshwanth Chavan on ridership, trainsets and frequency, and reporting BMTC feeder use (news): https://timesofindia.indiatimes.com/city/bengaluru/a-year-on-bengaluru-metros-yellow-line-carries-3-7-crore-passengers/articleshow/133222629.cms
- Knight Frank, India Real Estate, office and residential market, H1 2026 (Electronic City ₹5,700 to ₹8,600 per sq ft, +10% in 12 months, +2% in 6 months; city weighted average ₹9,354 per sq ft, +9%; South Bengaluru 34% of sales and 36% of launches): https://content.knightfrank.com/research/3116/documents/en/india-real-estate-office-and-residential-market-h1-2026-12927.pdf
- The Hindu, Colliers on the Yellow and Pink lines, Nadar's "almost 45%" comment, the up-to-40% housing line, and the office figures, 22 Apr 2026, updated 23 Apr 2026 (news): https://www.thehindu.com/news/cities/bangalore/yellow-pink-metro-lines-to-spur-realty-prices-report/article70892876.ece
- The Economic Times, locality table sourced to "Industry, Colliers", Electronic City at 45% for 2025 vs 2023 and 20% to 30% for 2027 vs 2025, 22 Apr 2026 (news): https://economictimes.indiatimes.com/wealth/real-estate/bengaluru-property-prices-can-rise-by-20-to-40-in-jp-nagar-bannerghatta-road-and-these-areas-due-to-yellow-line-pink-line-metro-report/articleshow/130433426.cms
- Realty Plus, "close to 47%" compared with pre-metro levels, no start year or dataset named, 14 Jan 2026: https://www.rprealtyplus.com/news-views/why-electronic-citys-real-estate-is-riding-the-metro-wave-123685.html
- Kaveri, Karnataka stamps and registration: https://kaveri.karnataka.gov.in/
- Karnataka RERA project search: https://rera.karnataka.gov.in/viewAllProjects?language=en