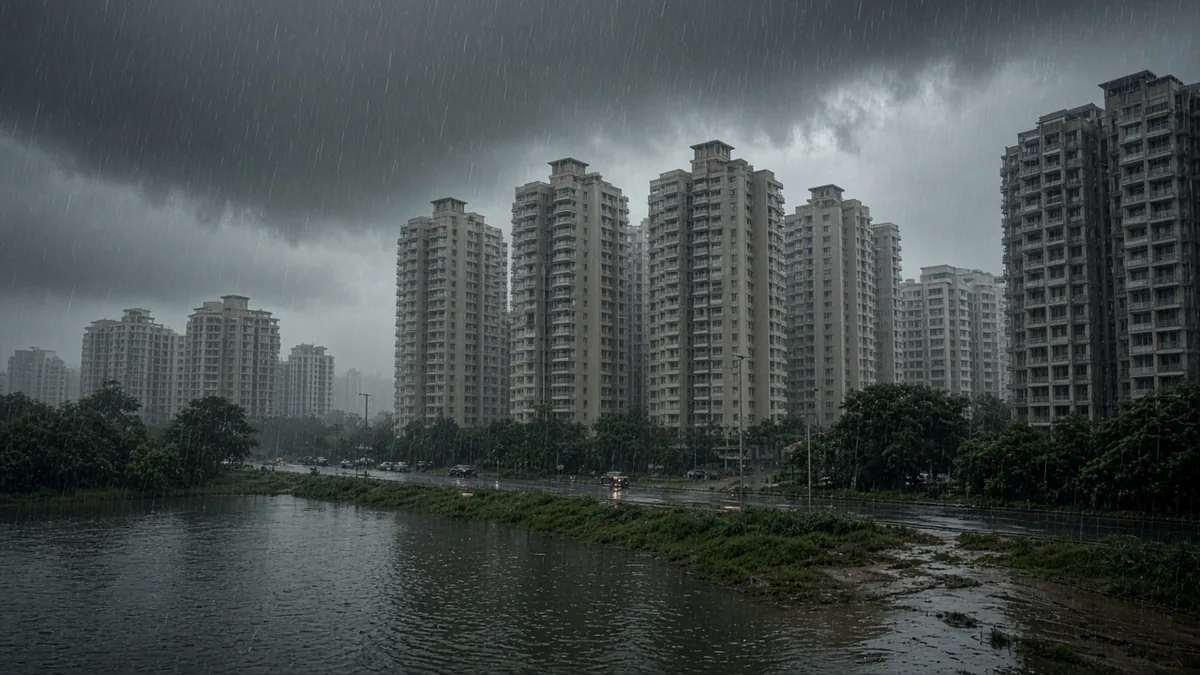
Short answer: Bengaluru flood exposure is highest where new supply is moving. About 38% of projects K-RERA approved from 2020 to mid-October 2026 (1,031 of 2,692) sit in Anekal, Devanahalli and Hosakote taluks, where an IISc-led study rated roughly 40% to over 50% of land as high or very high flood hazard. The city's flood-point list doesn't cover those taluks at all.
- Three high-hazard taluks hold 38% of approvals: Anekal (603), Devanahalli (242) and Hosakote (186), on our count of the K-RERA register, 2020 to 15 Oct 2026.
- The city list stops at the city: the 101 flood-prone points counted in April 2026 cover only the five GBA corporations.
- Project-level data agrees: a private study of 611 RERA projects found 53.2% on or beside a drain or on low-lying land (news).
- Small rain can be enough: KSNDMC's 2023 report listed road points that flood at 1 cm to 4 cm of rain.
- Our exposure index sets hazard share against approved projects, taluk by taluk.
- What does the flood exposure index measure?
- Which taluks combine high hazard and many projects?
- Why doesn't the city's flood list help in these taluks?
- How much rain does it take?
- What does project-level evidence show?
- Worked examples
- The FLOW check (our framework)
- Buyer checklist
- Lawyer note
- Frequently asked questions
- Talk it through with acre&key
- Sources
This is a data study, not a map of individual projects. We haven't geocoded each K-RERA project, and we don't name any. What we can do is line up three public datasets that rarely appear together.
What does the flood exposure index measure?
It asks one question per taluk: how many projects are registered here, and how much of the land carries high flood hazard?
We used:
- Projects: our own count of approved residential, plotted and mixed projects by taluk from the K-RERA register, 1 Jan 2020 to 15 Oct 2026, captured 15 Oct 2026. It's the same data as our RERA approvals by taluk study, which covers seven taluks.
- Hazard: the IISc-led flood and drought hazard study covering Bengaluru Urban, Bengaluru Rural and Ramanagara, as reported by Bangalore Mirror, 14 Oct 2026 (news).
- City flood points: 101 flood-prone locations across the GBA corporations, April 2026, from our flood-prone areas guide.
Which taluks combine high hazard and many projects?
| Taluk | Approved projects, 2020 to 15 Oct 2026 | Share of 2,692 | Plotted share | Area at high or very high flood hazard (IISc-led study) |
|---|---|---|---|---|
| Bengaluru East | 643 | 23.9% | 8.1% | Not reported |
| Anekal | 603 | 22.4% | 43.9% | Over 40% |
| Bengaluru South | 556 | 20.7% | 25.2% | Not reported |
| Bengaluru North | 329 | 12.2% | 17.9% | Not reported |
| Devanahalli | 242 | 9.0% | 77.7% | Over 50% |
| Hosakote | 186 | 6.9% | 51.6% | Nearly 40% |
| Yelahanka | 133 | 4.9% | 24.1% | Not reported |
The news report gives taluk figures only for the three hotspots. It says nearly half of the whole region faces high to very high flood hazard, and that flood exposure is concentrated in the urban core, where vulnerability is lower. So "not reported" doesn't mean low.
The counts exclude commercial projects. In the three hotspot taluks, plotted layouts make up a large share, from 43.9% in Anekal to 77.7% in Devanahalli, so many buyers there are buying land, not flats. Hosakote is also the only one of the seven taluks where approvals rose in January to September 2026 against the same months of 2025 (40 against 30).
Why doesn't the city's flood list help in these taluks?
Because Anekal, Devanahalli and Hosakote sit largely outside the GBA. The April 2026 count of 101 flood-prone points (48 West, 24 South, 20 East, 6 North, 3 Central) covers only the five corporations (The New Indian Express, news).
That creates a blind spot. A buyer in Sarjapur town or near the airport who checks "the flood list" finds nothing and may read that as safe. The IISc-led study suggests the opposite for a large share of that land. Use our ward and corporation lookup to see whether an address is inside the GBA at all.
How much rain does it take?
KSNDMC's 2023 report to the then BBMP listed how much rain some road points could take before flooding (Bangalore Mirror, 12 Apr 2023, news):
| Point (2023) | Rain that could cause flooding |
|---|---|
| Panathur Main Road | 1 cm |
| Kalyan Nagar ring road stretch | 3 cm |
| KR Puram | 4 cm |
| Mahadevapura | 4 cm |
These are road points from 2023. Some may have been fixed since. The lesson is that ordinary showers, not just cloudbursts, can cut off an approach road.
What does project-level evidence show?
A study by a private research firm of 611 RERA-approved projects launched over five years across 69 micro-markets found (Times of India, news):
| Finding | Share | Projects |
|---|---|---|
| On or beside a stormwater drain | 45% | 275 |
| Low-lying land, not near a drain | 8.2% | 50 |
| Some water-related site risk | 53.2% | 325 |
| Near a primary drain | 3.1% | 19 (14 high impact) |
| Near a secondary drain | 12.6% | 77 (57 high impact) |
Smaller drains were more often inside the layout, which makes them easy to miss on a site visit. Near a drain doesn't mean a flat floods; it means you check.
Worked examples
Worked example 1: a rough exposure estimate
If projects were spread evenly across each hotspot taluk (they aren't, so treat this as a sense of scale, not a count):
| Taluk | Projects | Hazard share used | Projects on high-hazard land if evenly spread |
|---|---|---|---|
| Anekal | 603 | 40% (floor of "over 40%") | about 241 |
| Hosakote | 186 | 40% ("nearly 40%") | about 74 |
| Devanahalli | 242 | 50% (floor of "over 50%") | about 121 |
| Total | 1,031 | about 437 |
That's roughly one in six of all 2,692 approvals in the seven taluks, from three taluks alone. The real number could be higher or lower depending on where projects cluster.
Worked example 2: two buyers, two blind spots
Buyer A looks at a flat inside the East corporation. The city list shows 20 points in East, and a quick check finds none on her road. That's useful, but the 2023 report had Mahadevapura and KR Puram road points flooding at 4 cm, so she still visits after rain. Our Varthur and Bellandur guides list the East's known trouble spots.
Buyer B looks at a flat in Devanahalli taluk. No city list covers it, so he finds nothing. On the IISc-led study, more than half of the taluk is high or very high hazard. With no list, his checks are the drain and lake buffers on the approved plan and a wet-day visit. See our Devanahalli guide and Hoskote guide, or compare Devanahalli vs Yelahanka.
The FLOW check (our framework)
| Step | What you check | Where |
|---|---|---|
| F: Flood list | Is a listed point on the approach road? (GBA only) | Varunamitra, city list |
| L: Land hazard | Is the taluk a hotspot? | IISc-led study |
| O: Outfall | How far are the nearest drain and lake, and what buffer applies? | Approved plan, survey map |
| W: Wet-day visit | What happens after heavy rain? | Site, residents, watchmen |
Our lake and drain buffer guide covers step O in detail.
Buyer checklist
- [ ] Find the project's taluk and whether it's inside the GBA.
- [ ] Check Varunamitra for vulnerable spots on the approach road.
- [ ] Ask for the survey map and approved plan, and mark drains and lakes.
- [ ] Work out the lake buffer from the lake's size in acres.
- [ ] Look for a drain inside the layout, shown as a "water feature" or "stream".
- [ ] Visit the morning after heavy rain.
- [ ] Ask residents nearby whether basements have flooded.
- [ ] Check the project's RERA filings for water-body NOCs.
Lawyer note
Lake and drain buffers depend on survey records and the approved plan. Ask a property lawyer to confirm them for any specific property.
Frequently asked questions
On the IISc-led study reported in October 2026, Devanahalli (over 50% of area), Anekal (over 40%) and Hosakote (nearly 40%) were the hotspots. Other taluk figures weren't reported.
On our count of the K-RERA register, 1,031 of 2,692 projects approved from 2020 to 15 Oct 2026, about 38%, are in Anekal, Devanahalli and Hosakote combined.
No. The April 2026 list of 101 flood-prone points covers only the five GBA corporations. Areas outside them need site-level checks instead.
No. Hazard share is land-wide, not plot-level. It tells you to check harder, especially drains, lakes and ground level, and to visit after rain.
A private study of 611 RERA-approved projects found 53.2% on or beside a stormwater drain or on low-lying land. It's a news-reported study, not an official audit.
KSNDMC's 2023 report listed Panathur Main Road at 1 cm and KR Puram and Mahadevapura at 4 cm. Some points may have been fixed since.
We don't name projects or builders. Use the FLOW check on any project you're considering, or ask us to run it with you.
No. Varunamitra shows vulnerable points, not parcels. A parcel check needs the survey map, the approved plan and a site visit.
Sources
Checked 19 Oct 2026.
- Karnataka RERA, View All Projects register, approved projects by taluk, captured 15 Oct 2026 (acre&key count): https://rera.karnataka.gov.in/viewAllProjects?language=en
- Karnataka RERA: https://rera.karnataka.gov.in/
- Bangalore Mirror, IISc-led flood and drought hazard study, 14 Oct 2026 (news): https://bangaloremirror.indiatimes.com/bangalore/civic/red-alert/articleshow/134923907.cms
- The New Indian Express, 52 of 101 flood-prone locations yet to be fixed, 11 Apr 2026 (news): https://www.newindianexpress.com/cities/bengaluru/2026/Apr/11/52-of-101-flood-prone-locations-in-bengaluru-yet-to-be-fixed-before-monsoon
- Bangalore Mirror, KSNDMC report on rain thresholds, 12 Apr 2023 (news): https://bangaloremirror.indiatimes.com/bangalore/others/1-cm-of-rain-can-cause-floods-in-bengaluru/articleshow/99416059.cms
- Times of India, study of 611 RERA projects and water risk (news): https://timesofindia.indiatimes.com/city/bengaluru/buyer-beware-study-flags-water-risk-beneath-new-homes-in-bengaluru/articleshow/132812524.cms
- Varunamitra, flood-vulnerable spots: https://varunamitra.karnataka.gov.in/Default/Index?service=VulnerableSpots