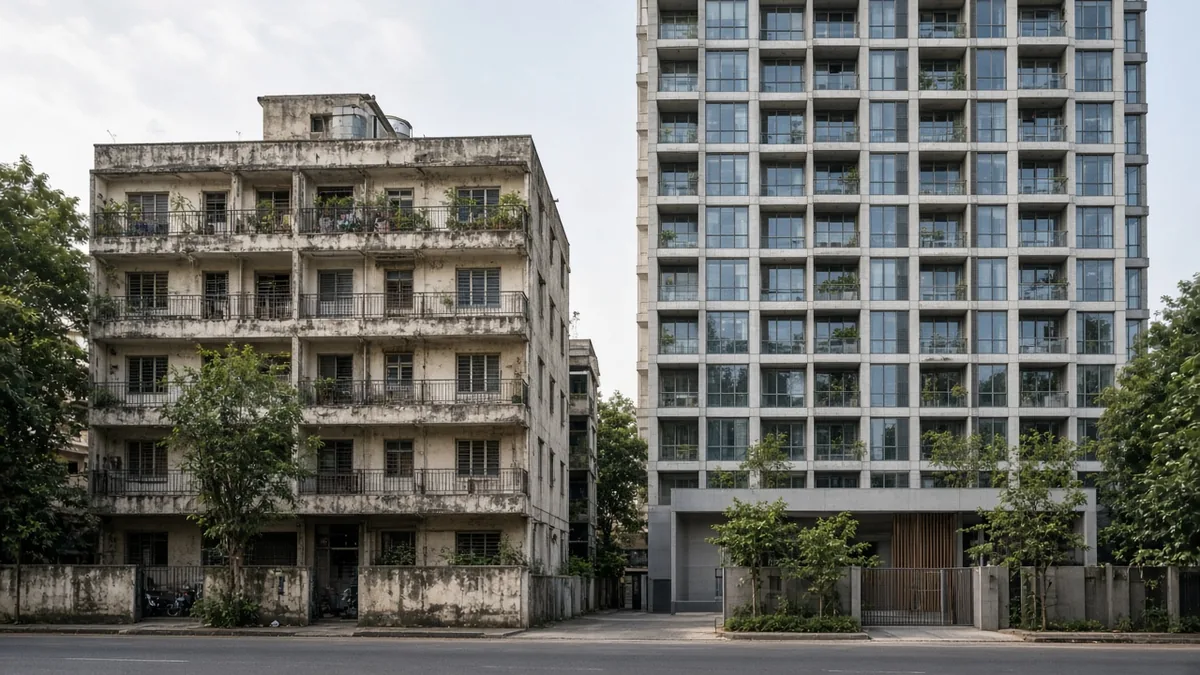
Short answer: In the cheap vs expensive homes question, neither is safe by default. In Bengaluru, homes under ₹50 lakh had 21.4 quarters of unsold stock in H1 2026, so resale can be slow. The ₹2 to 5 crore band saw unsold stock rise 153% as launches surged. A home turns bad when you can't sell it or can't carry it.
- Under ₹50 lakh: 17,809 unsold homes and a quarters-to-sell figure of 21.4, the highest of the main bands (Knight Frank, H1 2026).
- ₹1 to 5 crore: sales held up, but unsold stock rose 60% (₹1 to 2 crore) and 153% (₹2 to 5 crore).
- Rent covers about half the EMI in the five areas with published rents, so most buyers who invest top up every month.
- In our example, the price has to rise about 3.9% a year for five years just to break even.
- Our SELL test: supply, exit buyers, location, leverage.
"Buy the cheapest flat in a good area" and "buy quality, it holds value" are both common advice. The data says each can go wrong in Bengaluru, for different reasons. This page shows when.
What does the data say by price band?
Knight Frank's H1 2026 report gives unsold stock and quarters-to-sell (QTS) by ticket size for Bengaluru. QTS is how long the current unsold stock would take to clear at the recent sales pace (Knight Frank).
| Price band | Unsold homes (YoY change) | Quarters to sell | Share of sales, H1 2025 → H1 2026 |
|---|---|---|---|
| Under ₹50 lakh | 17,809 (−4%) | 21.4 | 6% → 3% |
| ₹50 lakh to ₹1 crore | 22,339 (−5%) | 6.1 | 24% → 19% |
| ₹1 to 2 crore | 20,642 (+60%) | 3.1 | 47% → 46% |
| ₹2 to 5 crore | 12,531 (+153%) | 3.6 | 22% → 29% |
| ₹5 to 10 crore | 604 (−28%) | 4.4 | not shown separately |
The sales-share values are read from the report's chart. Above ₹10 crore the counts are small (a few hundred homes), so we haven't drawn conclusions there.
When does a cheap home become a bad investment?
- When nobody's buying in that band. A QTS of 21.4 means more than five years of new stock at the current pace. Your resale competes with it.
- When it's cheap because of the paper. B-khata, missing approvals or no OC can make a flat hard to finance for the next buyer. See our khata guide.
- When it's cheap because of the location. Long commutes, tanker water or flood exposure limit who will rent or buy. Check our flood exposure index.
- When the rent is low too. On ANAROCK's figures, Mysore Road's gross yield was 3.51%, below the 4.1% to 4.3% in four other areas (our rental yield guide).
When does an expensive home become a bad investment?
- When supply floods your band. Unsold stock in ₹2 to 5 crore rose 153% in a year, according to Knight Frank. More choice for buyers means less pricing power for sellers.
- When the buyer pool is thin. Fewer households can buy at ₹3 crore than at ₹1 crore, so it can take longer to find a buyer when you sell. Our affordability index shows how stretched EMIs already are.
- When entry costs are large. Stamp duty and registration at 7.6% on ₹3 crore is ₹22.8 lakh you don't get back.
- When you pay for features the next buyer won't value. Our ₹2–5 crore questions cover this.
We don't have published rent data for the ₹2 to 5 crore band, so we can't say whether yields there are higher or lower.
Worked examples
Worked example 1: what a slow sale costs
Illustrative. Two owners each take six months longer to sell than planned, paying the EMI while they wait. Loans are at the RBI caps (80% up to ₹75 lakh, 75% above), at 8.5% over 20 years.
| ₹45 lakh flat | ₹3 crore flat | |
|---|---|---|
| Loan | ₹36,00,000 | ₹2,25,00,000 |
| EMI | ₹31,242 | ₹1,95,260 |
| Six months of EMI | ₹1,87,449 | ₹11,71,557 |
| As a share of the price | 4.2% | 3.9% |
The cost is similar as a share of the price. What differs is how likely the delay is in your band, which is where QTS helps.
Worked example 2: the price rise an investor needs
Illustrative, using our rental yield guide's Whitefield example: a ₹1,06,80,000 flat with a 75% loan (₹80,10,000) at 8.5% over 20 years, held for five years.
| Item | Working | Amount |
|---|---|---|
| Stamp duty and registration | 7.6% × ₹1,06,80,000 | ₹8,11,680 |
| Interest over five years | From the loan schedule | ₹32,19,746 |
| Net rent over five years | ₹3,52,500 × 5 | −₹17,62,500 |
| Gain needed to break even | ₹22,68,926 |
That's 21.2% over five years, about 3.9% a year compounded, before selling costs and before counting what your ₹26.7 lakh down payment could have earned elsewhere. Bengaluru prices rose 9% in the year to H1 2026 on Knight Frank's figures, but past growth doesn't promise future growth. See our buy now or wait signals.
The SELL test (our framework)
| Letter | Question | Red flag |
|---|---|---|
| S: Supply | How much unsold stock is in your band and area? | QTS rising, launches outpacing sales |
| E: Exit buyers | Who buys this from you, and can they get a loan? | Paper problems, or a very thin buyer pool |
| L: Location | Will people still want to live here in ten years? | Commute, water or flood problems |
| L: Leverage | Can you carry it if rent or resale is slow? | Rent under half the EMI, no buffer |
If you're buying to live in, a slow resale matters less. If you're buying to invest, all four lines matter.
Checklist before you buy at either end
- [ ] QTS and unsold trend for your price band
- [ ] Paper clean enough for the next buyer's bank
- [ ] Commute, water and flood checked
- [ ] Rent ÷ EMI worked out
- [ ] Break-even price rise worked out over your holding period
- [ ] Six months of EMI set aside
- [ ] Compared with renting (rent vs buy)
Frequently asked questions
Neither by default. Cheap homes can be slow to sell; expensive ones face rising supply and high entry costs. Check supply, exit buyers, location and carry costs.
Knight Frank's H1 2026 data shows 21.4 quarters to sell in that band, as buyers moved up to costlier homes. More stock competes with your resale.
Unsold stock there rose 153% in a year, while launches rose 50% and its share of sales grew. QTS was 3.6 quarters. Watch whether sales keep pace.
The time unsold stock would take to clear at the recent sales pace. Lower is healthier. It's a market measure, not a forecast for your flat.
Not in the five areas with published rents. On ANAROCK's Q1 2026 figures, rent covered about 42% to 51% of the EMI.
In our Whitefield example, about 3.9% a year over five years, before selling costs and the return your down payment could earn elsewhere.
Not automatically. Quality helps, but supply in your band, the buyer pool and entry costs decide resale too.
Only after checking paper, location and resale demand in that band. A low price can reflect real problems.
Sources
Checked 19 Oct 2026.
- Knight Frank, India Real Estate: Office and Residential Market H1 2026, Bengaluru (ticket-size unsold stock, QTS, sales split, price change): https://content.knightfrank.com/research/3116/documents/en/india-real-estate-office-and-residential-market-h1-2026-12927.pdf
- ANAROCK, Q1 2026 rents and base prices, as used in our rental yield guide: https://acrenkey.com/blogs/insights/rental-yield-in-bengaluru-by-area-investor-guide-2026/
- RBI Master Circular, Housing Finance (LTV): https://www.rbi.org.in/Scripts/BS_ViewMasCirculardetails.aspx?id=12824
- IGR Karnataka, Table of Registration Fees: https://igr.karnataka.gov.in/storage/pdf-files/RegistrationFee.pdf